
How Tall Will New Buildings in My Neighborhood Be? A New 3-D Map Tells Us
With everything going on in the world, you may have missed a great new resource DNAinfo recently released: an incredible interactive 3D rotatable map,called How Tall Will New Buildings in My NYC Neighborhood Be?
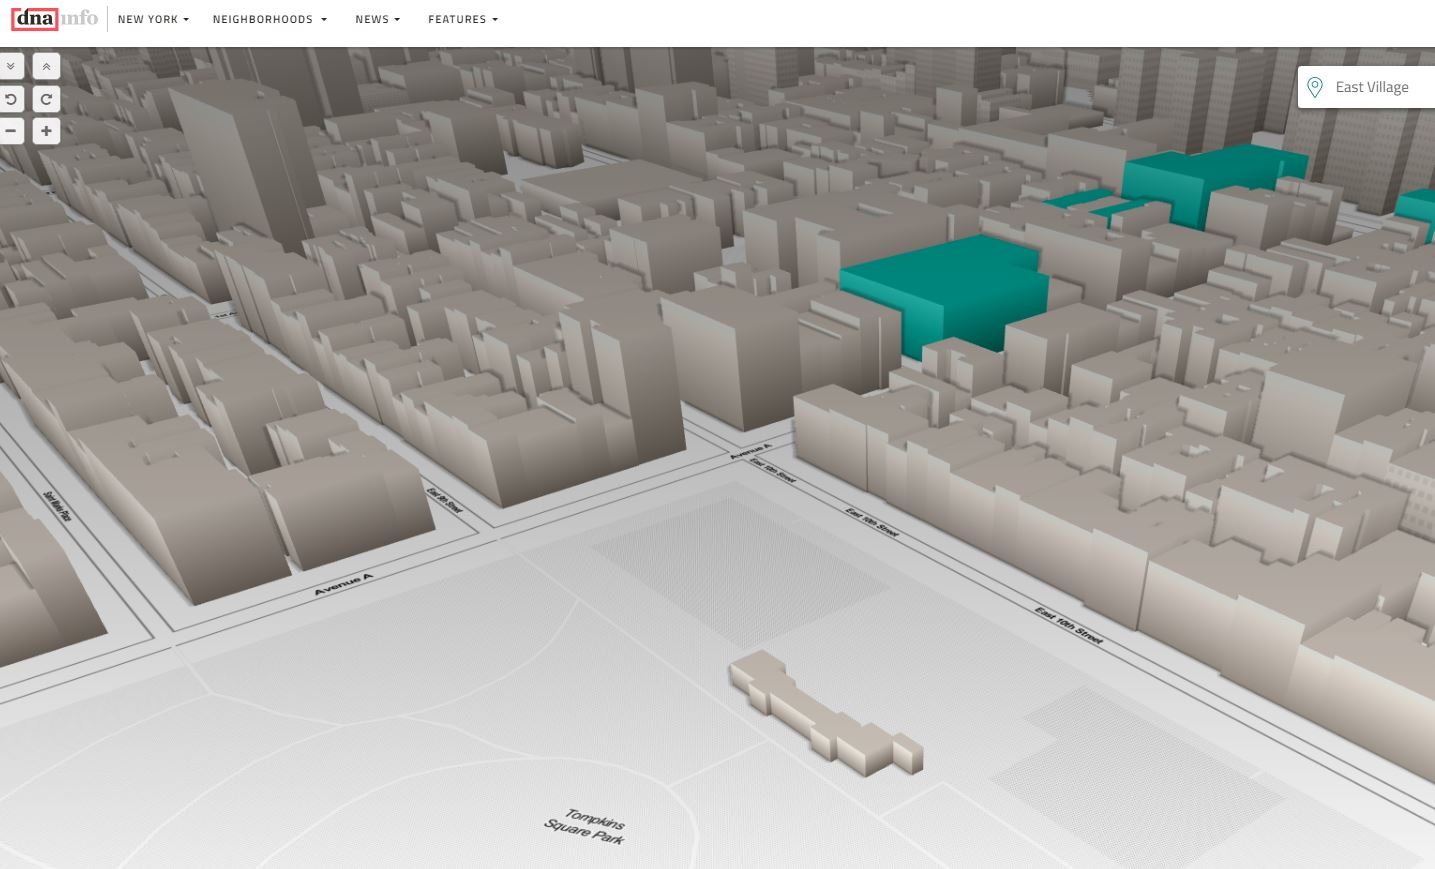
Their 3-D map shows what construction could do to every neighborhood’s skyline and streetscape. To help you see how you could be affected, click here for their map.
How did they do it? DNAinfo used MapPluto 16v2 (MapPluto) for the underlying geography of each parcel across New York City. MapPluto combines NYC Department of Planning’s tax lot data from PLUTO with data from the NYC Department of Finance’s Digital Tax Map. This data is from September 2016. DNAinfo then calculated building heights with a formula derived from the Council on Tall Buildings and Urban Habitat.
Approved Construction
Turquoise boxes represent areas where building permits have been issued. As far as the city’s concerned, these buildings are being built at this height. Buildings will go within this turquoise area. These are height indicators, not building designs. 
Proposed Buildings
Blue boxes have not yet had permits approved by the city. These are projects that may have been presented at local meetings, but haven’t completed the city’s building approval process. The height of these boxes reflect what developers have submitted.
And a very fun and interesting way the public can be involved is the Add a building section.
They have thousands of buildings on their map now, but there are many projects that DNAinfo has not yet reported on. Tell them about a building proposed in your neighborhood, and they might add it to the map. You have to back it up with information like weblinks or photos.
And it is helpful to visualize the ramifications of unfettered development. For example, the public could see what could potentially be constructed if MTA properties continue to be allowed to evade local zoning regulations. For example, if the unrestricted construction on MTA properties was allowed at say, West 13th Street, this is what it could look like.

It is a very comprehensive resource. One gap they are working on is projects now before the the NYC Board of Standards and Appeals (BSA). The BSA is where developers go if they want to build beyond the limitations imposed by zoning restrictions (see this article for a more comprehensive look at what the BSA does). GVSHP will also be having a forum on the BSA and what it does in April; check our Programs page for information.
For example, this is what the DNA Mapping resource indicates for 432 East 14th Street:

But currently the developer is seeking to build four stories higher than allowed through the BSA application process. If you plug that development proposal into the DNA resource, this is the approximate look. As a side note, the Immaculate Conception Church just a few buildings to the west of the site is not shown with its full profile, but overall this is an amazing resource! Check it out.

How do I check on East End Ave, NY 10028
Thanks for reading wendy. With DNAinfo reporting being put out of business it seems that web map https://www.dnainfo.com/new-york/visualizations/skyline/ is no longer activie. You can also look up building permits by Community board here: http://a810-bisweb.nyc.gov/bisweb/bispi00.jsp In your area is also the organization Friends of the Upper East Side Historic Districts.